Citation: David Kurlander and Steven Feiner. History of Editable Graphical Histories. Watch What I Do: Programming by Demonstration. Allen Cypher (ed.). MIT Press. 1993. pp. 405-413.
Click here to visit the web site of the book, and click here for the book's table of contents.
There are many general reasons to maintain application histories: they are useful for undo and redo; they allow users to examine the commands that have been performed in a session, and to communicate this information with others. There are also a number of application-specific uses: for example, they facilitate navigation through hypertext documents and provide an interface for modifying individual steps of simulations. In the domain of programming by demonstration, histories have additional uses. Many programming by demonstration systems are trace-based rather than effect-based; that is, they produce a generalized procedure from a command history rather than an evaluation of the effects of these commands. If the user is to be allowed to modify or debug the procedure by editing a command sequence, then there should be a means of visually representing the history. As discussed in Chapter 15, command histories also support the tasks of selecting operations to be included in these procedures, generalizing them, and generating error messages.
Representing histories of graphical applications presents a special challenge, since they deal with objects that may have no readily understood textual representation. Typically, textual applications use the spatial browsing technique to represent their histories. They list commands executed during a session, one after another in a sequence. However, commands in graphical applications may have no textual name, and may deal with graphical attributes and geometric properties that cannot be conveyed intuitively in textual terms. Thus many graphical applications instead rely on temporal reexecution to communicate their command histories. Such applications can be scrolled backwards in time, while the effects of the operations are played back on the application canvas. Essentially this provides an animation of the steps performed in a session. Temporal reexecution emphasizes the effects of the commands, while spatial browsing focuses on the commands themselves.
A disadvantage of temporal reexecution is that it provides little context. At any moment, the history represents only a single point in time. Editing such a representation is difficult, analogous to editing a textual document in a line editor. There is no structure to the presentation; all commands, no matter how trivial are represented at the same level. We have developed another technique, called editable graphical histories, that combines aspects of spatial browsing and temporal reexecution to represent sequences of graphical interactions without the above drawbacks. Editable graphical histories, like comic strips, represent a series of events by a sequence of graphical panels. Examples of editable graphical histories appear in Chapters 12 and 15. This chapter discusses how this representation has evolved from its initial implementation in the Chimera editor to its current form, the reasons for the changes, and how the histories might change in the future.
One of the goals behind the design of these histories is that the users of an application should understand them without learning a multitude of new visual conventions. This discouraged us from using special meta-objects in the panels, such as arrows to signify a translation, when such objects do not appear in the original interface. Instead we chose to use a sequence of before and after panels to explain the operations. The panels depict the relevant portions of the interface precisely as they appear at the points in time represented. To determine the operations represented by a before and after pair, the user performs a mental differencing operation on the panels to detect the change.
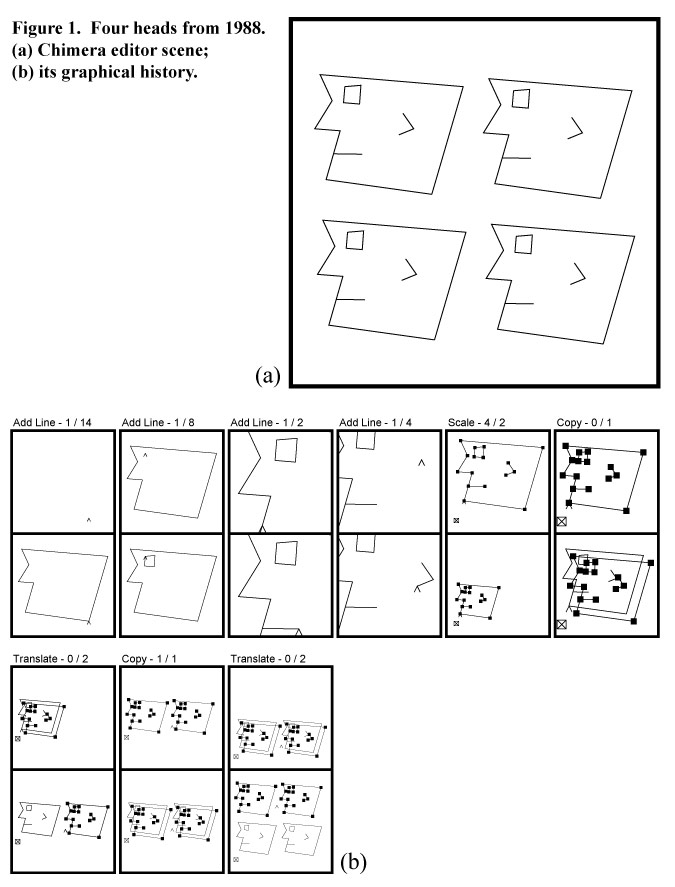
Figure 1a is an editor scene containing a simple drawing of four heads, generated by the steps depicted in the history shown in Figure 1b. The panels are grouped in pairs: the top panel shows the scene before the operations represented by the pair, the bottom panel shows the scene afterwards. We refer to the top panel as the prologue, and the bottom panel as the epilogue. The first panel includes those operations used to draw the outline. The second panel pair adds an eye, the third a mouth, and the fourth an ear. The fifth panel pair shows the head being selected and scaled. In the remaining panels, the head is copied, the copy is translated alongside the original, the two heads are copied, and the copies are translated above.
This history was generated in 1988, and it represents one of our first attempts at graphical histories [Kurlander 88b]. Related operations are coalesced into single panels. For example, the first panel contains several Add Line operations, as well as operations to move the cursor. This makes the history shorter, but it also makes it easier to understand because logical operations are depicted rather than physical ones. The default degree of coalescing can be adjusted according to the level of expertise of the user, or the task for which the history is used. If the component operations of a panel need to be examined in more detail, the panel pair can be split into lower-level pairs. The panels display only the portion of scene that is relevant to the operations that they represent, plus some scene context to show where the operations were performed.
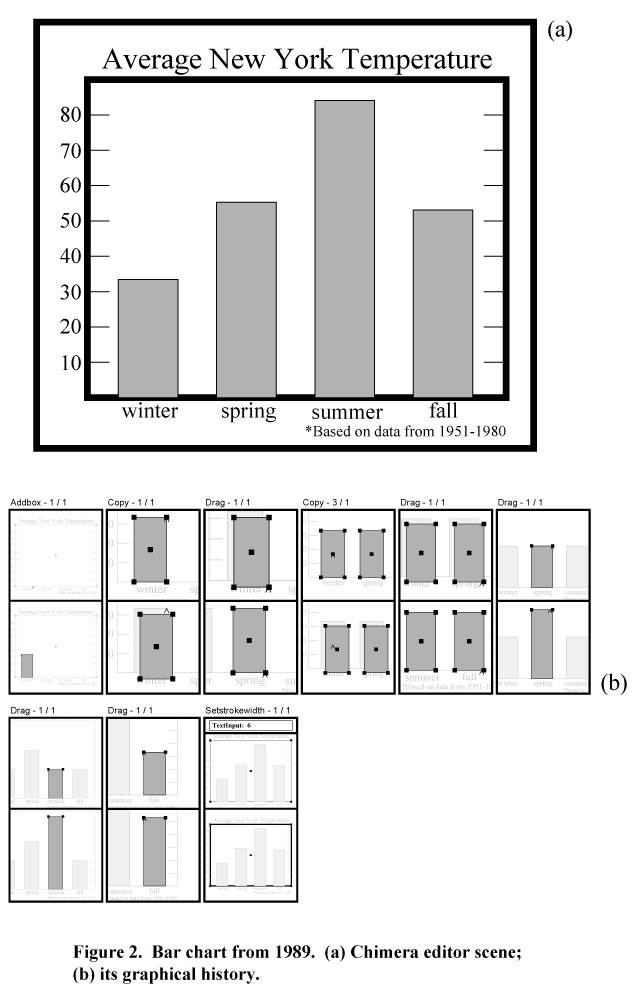
As illustrations generated in Chimera became more complex, it also became more difficult to quickly differentiate between the contents of the before and after panels. We needed a method to draw one's eye to the important parts of the panel, away from the auxiliary scene context. To accomplish this, we added rendering styles to the graphical histories. During the panel composition process, objects to be included in a panel are tagged with their reason for inclusion, or equivalently, their role in the explanation. For each object in a panel, the renderer examines the object's tags to determine what style should be used to draw the object. The association between rendering styles and object tags can be easily customized. By default, contextual objects are subdued by lightening their colors, and objects that participate in the panel's operations are rendered normally. This represents the state of the histories in 1989, and is further discussed in [Kurlander 90].
This technique was employed in producing the history panels of Figure 2 to make the important objects in each panel stand out. Figure 2a shows a bar chart drawn in Chimera, and Figure 2b shows steps that added the bars to the chart, and a command that changed the stroke width of the frame. The bar created in the first panel pair is an important result of the operation, so it is rendered in its normal fashion, while the rest of the chart, which is present only to show where the bar was added, has been subdued. In this and in subsequent panels, it is clear which objects are critical to the explanation, and which provide context.
Next it became clear that we needed to abandon the two row layout, and adopt a single row of panels. There were many reasons for this decision:
Another important decision was to move the histories out of the graphical editor component of Chimera, into its UIMS layer so that other graphical applications can take advantage of the facility. This task is only partially completed, but we are already reaping some of the benefits. One of our goals is that there be no added overhead on the application writer to get reasonable graphical histories for most applications. The system defaults to one operation per panel, unless the application writer provides a grammar to show how related operations should be coalesced into a single panel.
Eventually, we would like the history mechanism to make a good guess about which graphical objects and widgets should be included in each type of panel, without the explicit rules that must be provided now. These would be the objects and widgets modified or referenced by the operations in the panel, and the UIMS should be able to detect this. However, the application writer needs to be able to override the default, and explicitly specify the contents for each kind of panel. To make it easier to write rules, Chimera's current rule language can refer to an object-based command class hierarchy. Since rules can refer to classes of commands, not just individual commands, application developers can write rules for large families of commands at once.
Initially the histories were editable only in the sense that the user could explicitly execute a command to undo the editor to a state represented by any panel, make changes to the editor scene, and redo the undone commands. This process often felt indirect and clumsy, so we added an option to convert the history panels into fully editable Chimera scenes. Now changes can be made directly in the panels themselves, and users can execute a command to propagate these changes into the history stream.
Though we initially developed editable graphical histories with the intention of using them as a visual representation for macros by example [Kurlander 88b], we postponed implementing this until the individual panels could be made editable. Having editable panels allows us to select objects and properties directly from the panels to be used as macro arguments, and to edit the macros in place. Editable graphical histories support macros by example in many other ways as well, as is discussed in Chapter 15.
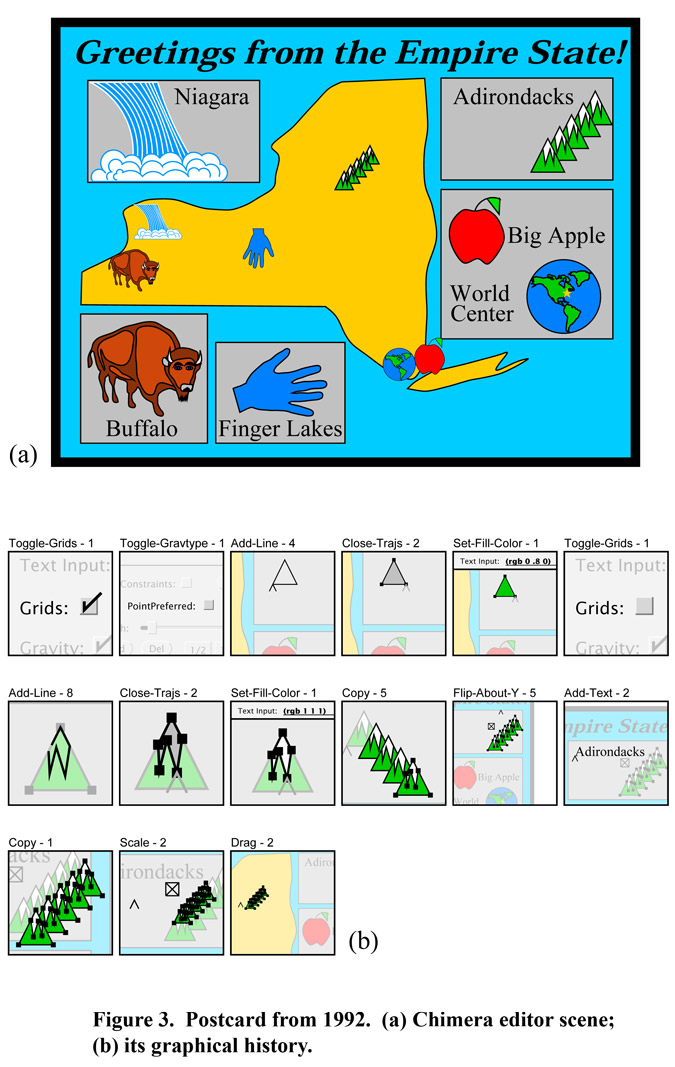
Figure 3a is a postcard drawn in Chimera, and Figure 3b is the graphical history showing how the Adirondack mountains were added to the illustration. The graphical history here was recently generated by Chimera (March 1992), and reflects the changes that we made over the years. Note that panels are no longer separated into before and after rows. Also, now that the history mechanism is partially in the UIMS, it is much cleaner for the system to generate panels showing parts of the control panels, since the goal of separating applications from interfaces dictates that the editor itself not know about the appearance of these components.
In our graphical editor domain, history panels record only user-initiated commands. Now that we are moving the history mechanism into the UIMS, the histories will be able to record interesting non-interactive events as well. Predominantly non-interactive graphical programs might generate graphical logs, rather than interaction histories, to record the changing state of their display.
Though picture panels can visually represent operation sequences performed in the past, they can also depict sequences that might be invoked in the future. Such futures (as opposed to histories) could be used by a system that automatically infers likely interaction paths in presenting potential steps to the user. They could be used as part of an active tutorial system for an application, to teach people how to reach probable targets. Alternatively, these futures might act as a type of "power steering" by experts to reach their goals faster.
Several interesting representational issues present themselves that could also be the target of future research. It would be helpful to investigate how changes to a history can be represented clearly within the history itself, and how histories might represent multiple applications, sessions, or users. Graphical histories can become quite long, and additional methods could be developed to represent them more compactly and facilitate navigation through them.